Soft Tail Subsystem
Soft Tail Design
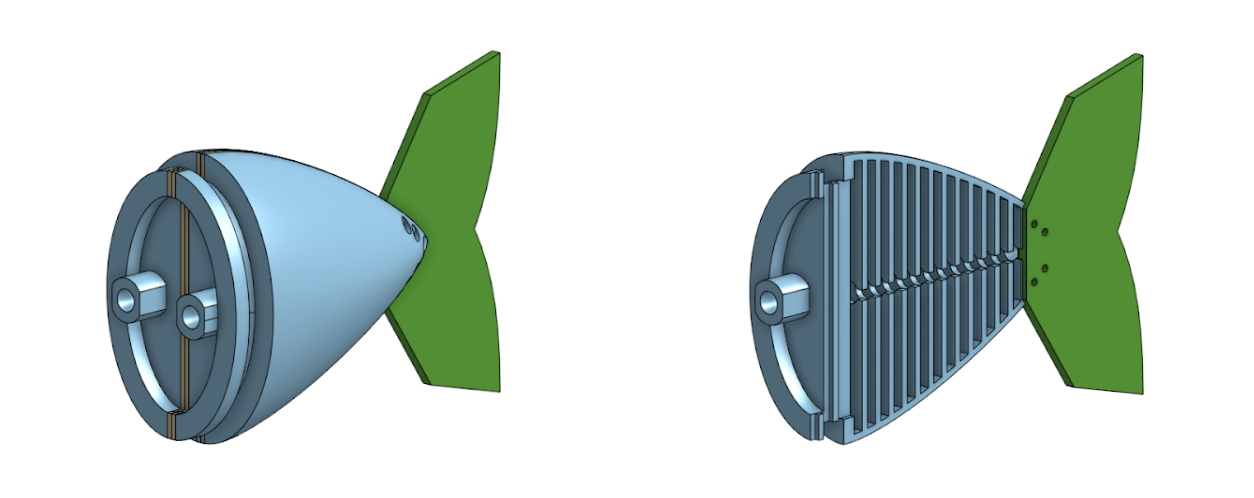
Our overall tail design is shown in Figure 1. The blue and orange sections are made of silicone, which is what makes the tail soft. The green part is a rigid fin at the end of the tail. Not pictured is a center constraint layer between the two flat orange sections composed of two pieces of hardstock taped together.

We see SoFi’s tail design in Figure 2. We designed our tail to mimic the shape of SoFi’s tail as closely as possible based on reference images and dimensions from SoFi’s Hydraulic Autonomous Soft Robotic Fish for 3D Swimming paper. However, our tail was about ½ the scale of Sofi’s tail so that our robot fish could be small. The proportions weren’t exact, but were as close as we could make them given reference images.
The key differences between our soft tail and SoFi’s soft tail come from Ever’s previous exploration of soft tails, manufacturing constraints, and budget constraints.
Whereas SoFi’s center constraint layer is a 0.5 mm thick flexible acetal sheet, our tail uses two pieces of cardstock to create a 0.45 mm thick constraint layer in conjunction with a 3.0 mm thick fin at the end of our tail. Ever’s previous exploration of soft tails showed this method was effective in creating curvature throughout the tail with soft tails manufactured similarly to how we planned to manufacture the soft tails for this project. This would minimize the risk in our soft tail design since we had evidence it was compatible with our manufacturing methods, and we had all necessary materials on hand.
Another key difference is the rib thickness. The ribs of our tail are thicker than they would be if they were based purely off of being proportional to SoFi’s ribs. This was because of our manufacturing constraints that only made it possible to make our ribs so thin before they would start collapsing in on themselves during tail fabrication. We chose an initial rib thickness based on Ever’s previous exploration of soft tails that showed this would be a safe rib thickness for our manufacturing methods.
The actual physics behind how our tail actuates is identical to SoFi’s, with the exception that we did not use a gear pump to actuate our tail. By pressurizing one chamber more than the other, we cause a deflection in the tail that makes the tail curve. By switching which side is pressurized, we can make the tail swing back and forth like a fish’s tail.
Soft Tail Optimization
Initial pump tests with our first soft tail showed that our pumps produced far more pressure than necessary to pressurize our tail, and that our limiting factor in soft tail actuation was actually the time necessary to depressurize a chamber. Based on those initial tests, we aimed to create a soft tail optimized to maximize the deflection for change in water volume, and minimize the time required to passively depressurize, or “deflate”. This would result in a tail that could quickly sway side to side.
We decided to manufacture and test 3 different soft tails. These were the 3 tails we tested, with callouts to what was unique about each tail. Note that “shell” refers to the silicone that encapsulates the tail.
- 2 mm shell, 4 mm ribs
- 2 mm shell, 2 mm ribs
- 3 mm shell, 2 mm ribs
We chose to vary these parameters in particular to achieve the optimizations we needed based on the results of a similar parameter sweep on a Pneu-nets actuator.[16]
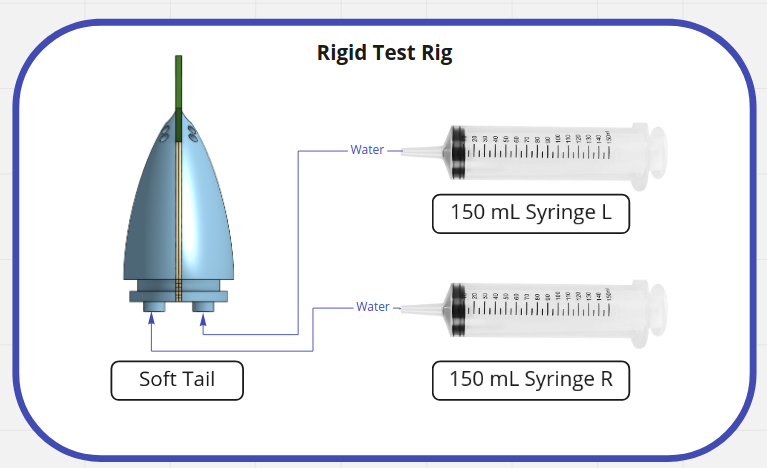
Figure 3 shows how we planned to set up our experiments. The syringes would make it easy to measure the change in volume of the chambers. By adding some kind of tiled surface below the tail and capturing photos or video from overhead, we could measure the deflection of the tail for different volumes of water. Timing the deflation time became trivial as all we needed to do was pressurize a chamber, and time how long it takes for the chamber to push the water back into the syringe.
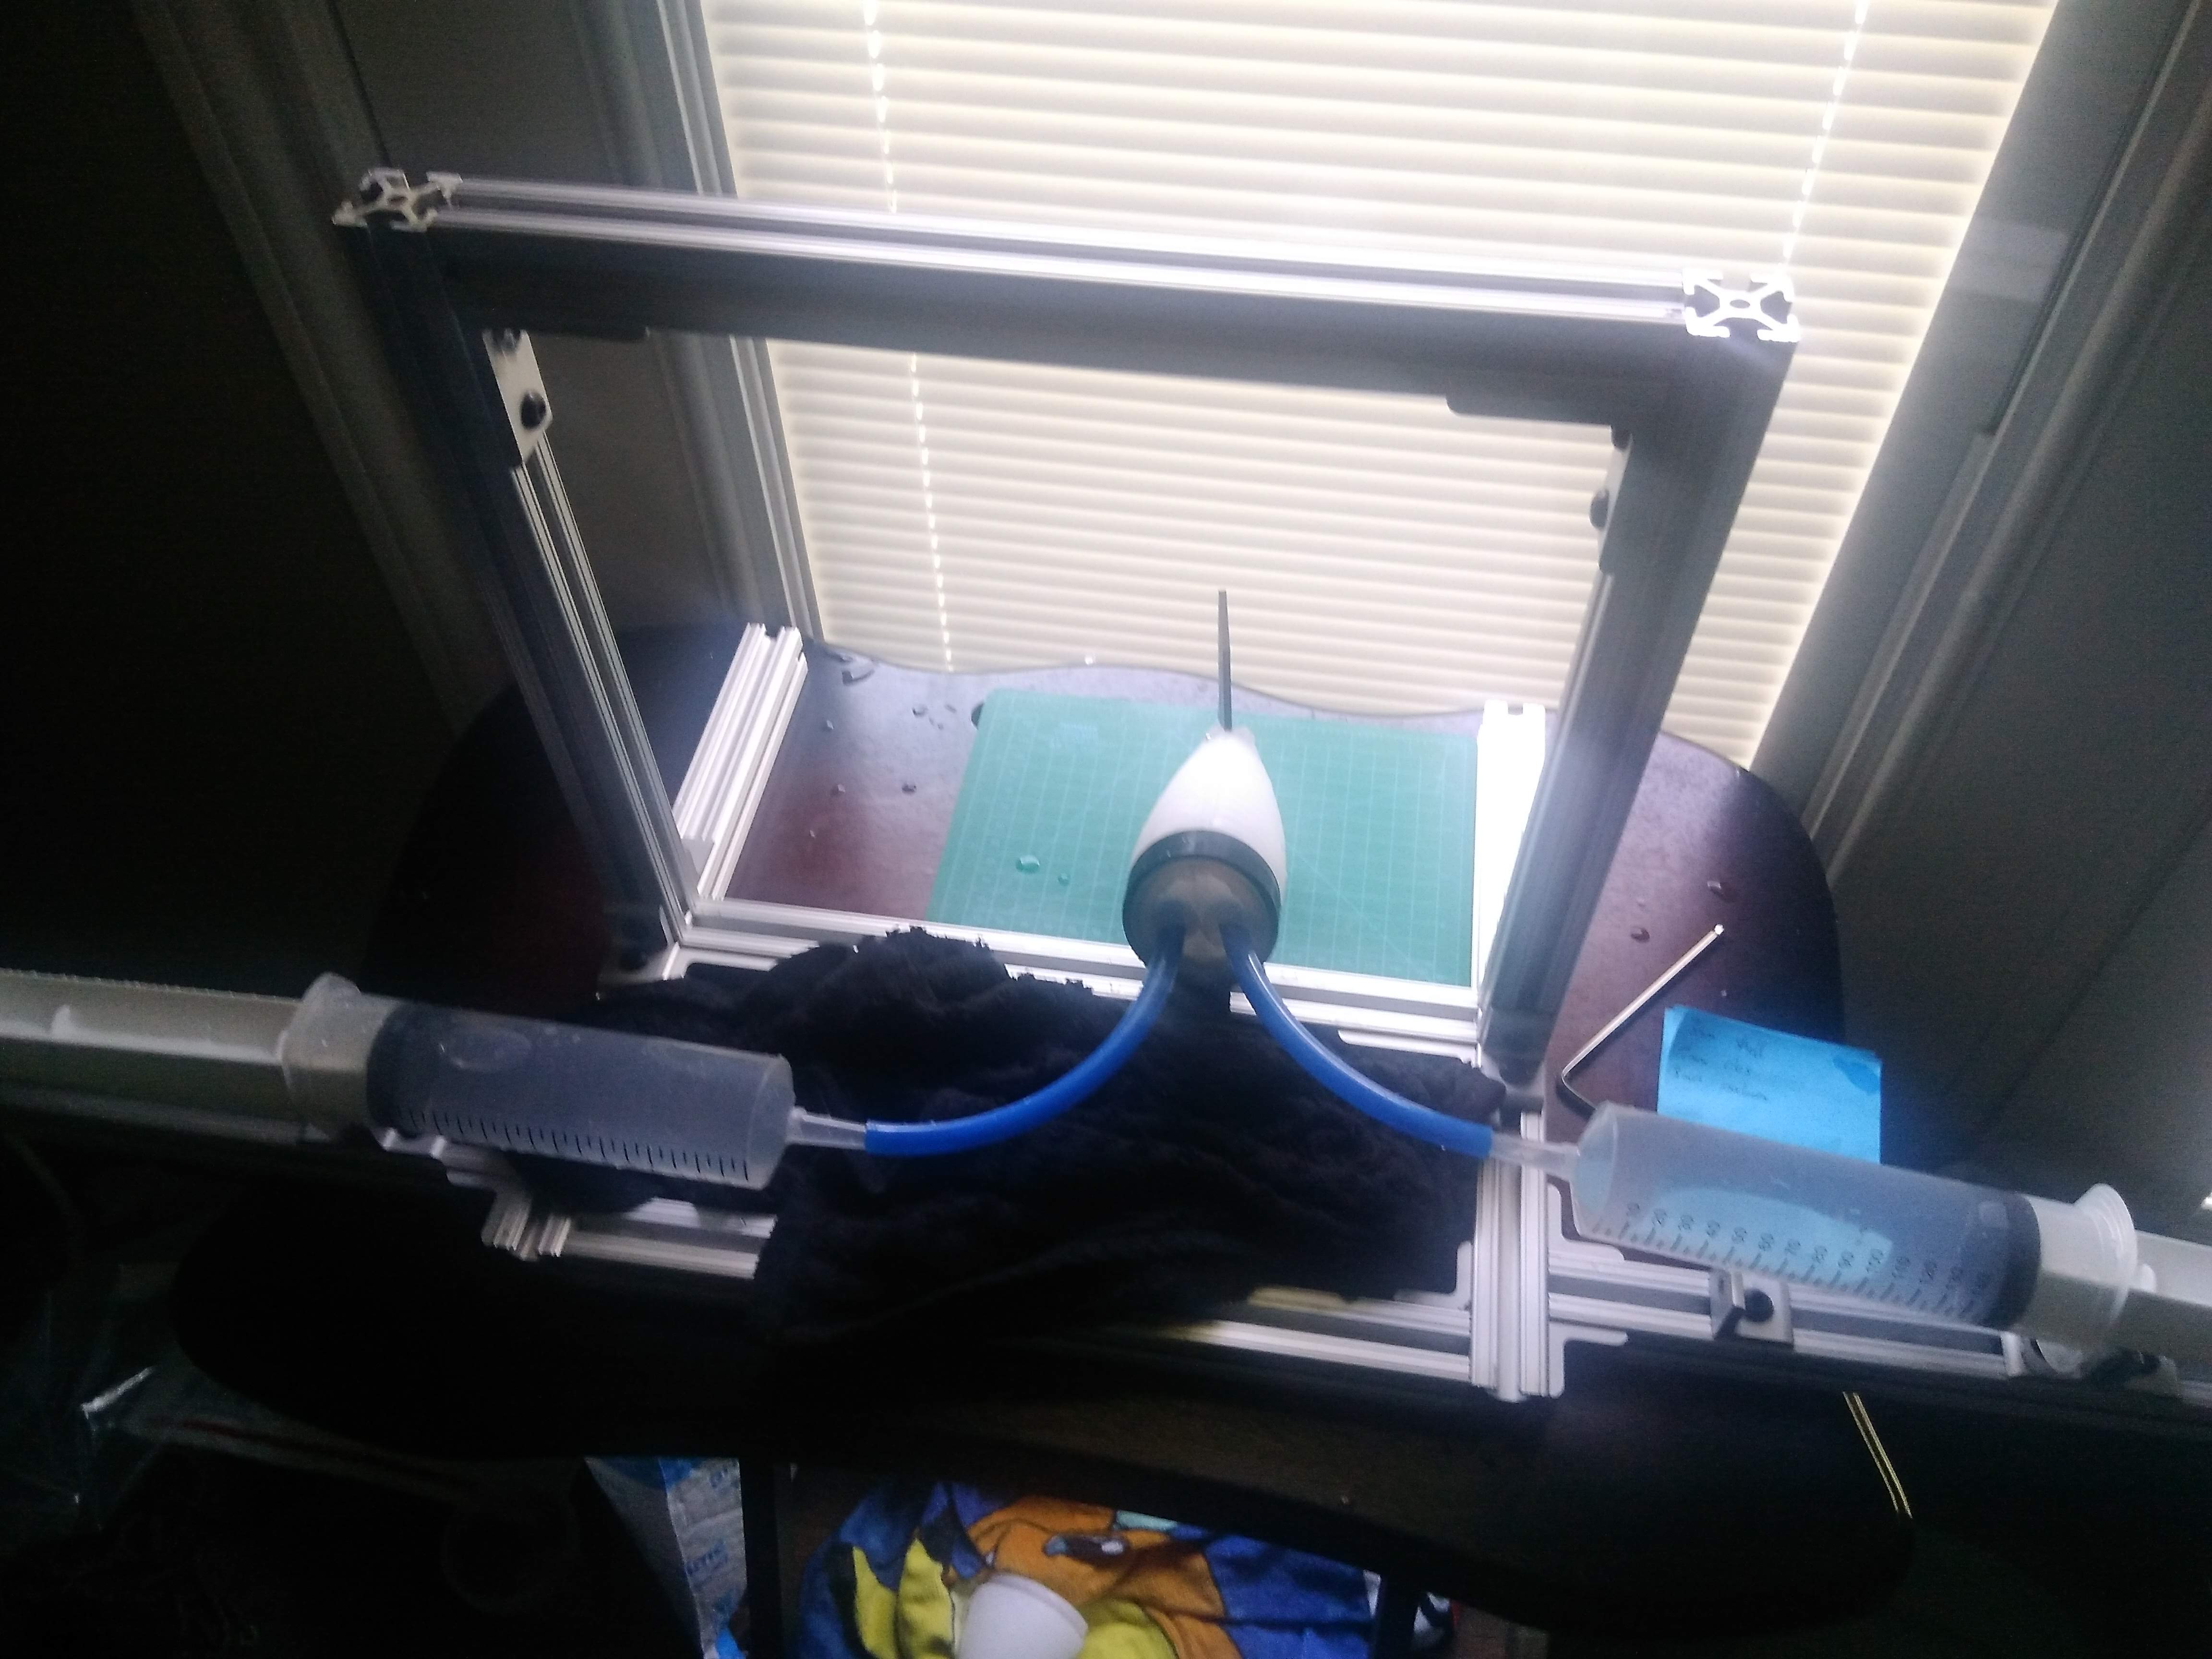
Figure 4 shows the testing rig we built to conduct our experiments. Ideally, this testing rig would be set up underwater, but we didn’t have access to an underwater space large enough at the time of testing to hold the entire rig, or the manufacturing capabilities to create a smaller rig.
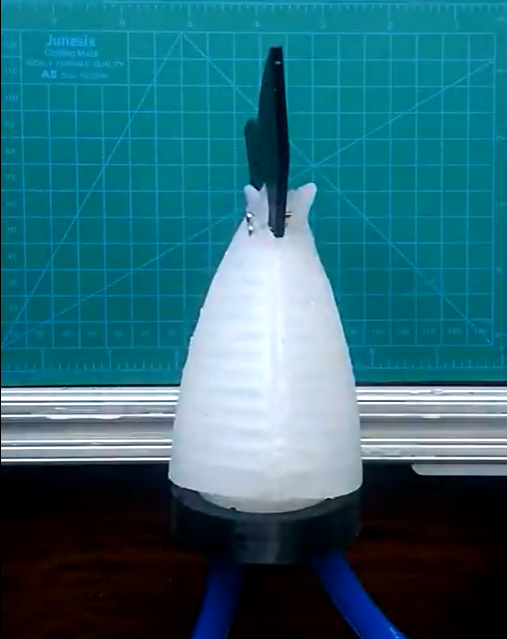
Figure 5 shows the overhead view of the tail in the testing rig from the camera that we used to measure the tail’s deflection. Note that the grid below the tail makes it easier to measure the deflection of the tail, but we did not take into account camera parameters that might have slightly influenced the measurement of deflection.
Results and Analysis
Deflection
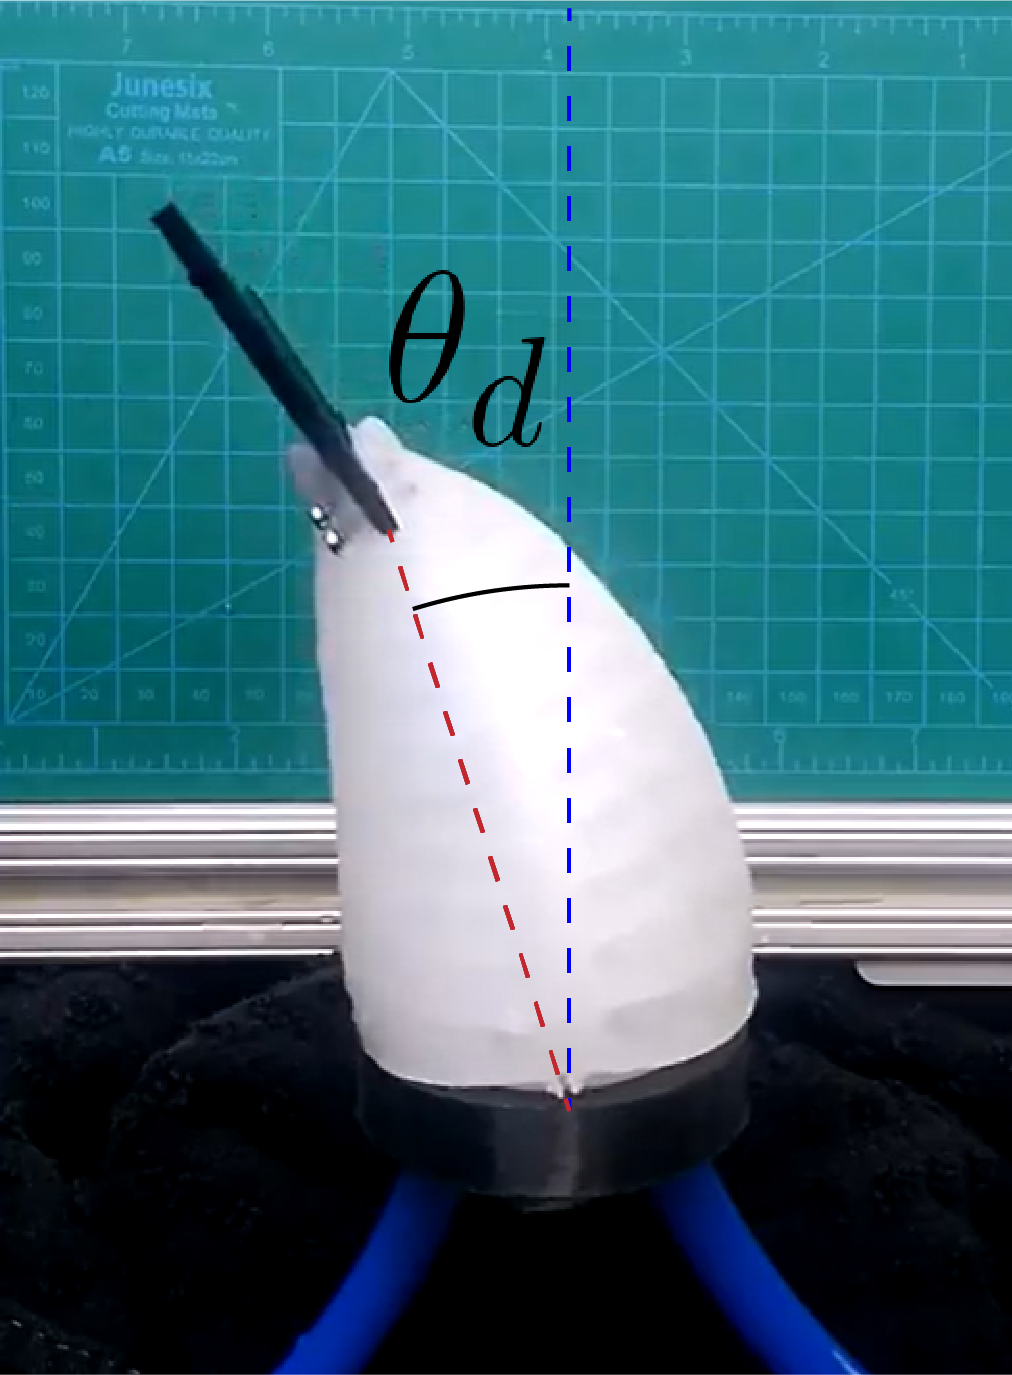
Figure 6 shows how we measured deflection for each tail. We calculated the angle between the center constraint of the tail and the front of the fin. This angle seemed to best capture the overall deflection of the tail. The following plots show how much deflection was achieved with each tail for different volumes of water added to each chamber.
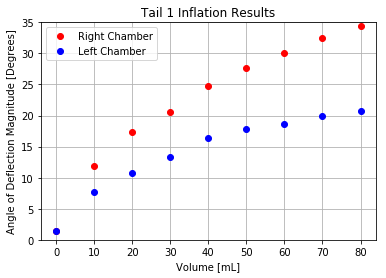
In Figure 7 we can see the inflation results for the first tail. Unfortunately, the left chamber had a leak, so the recorded angle of deflection for the left chamber is not completely reliable as the water was leaking out of the chamber as recorded the angle of deflection. This tail had the highest angle of deflection for volume of water added into a chamber, capping out at 35 degrees, which was almost 10 degrees higher than the other tails.
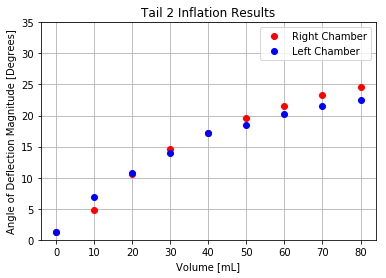
In Figure 8 we see the inflation results for the second tail. We can see that this tail does not perform as effectively as Tail 1 at inflation. This suggests that thicker ribs result in a higher angle of deflection per volume added to a chamber.
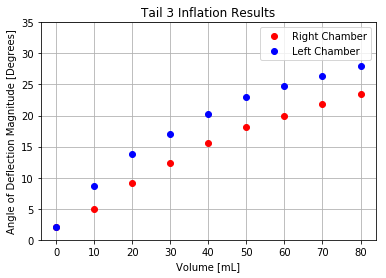
In Figure 9 we see the inflation results for the third tail. We can see that there’s a significant deviation between the angle of deflection that results from inflation of the right chamber versus the angle of deflection that results from inflation of the left chamber. This deviation comes in part from the fact that the tail was slipping out of its test rig as it was being pressurized, making it difficult to accurately capture the angle of deflection, and the slipping was different depending on which chamber was being pressurized.
With the results we see here, we can see that this tail is more effective at actuating compared to Tail 2. This suggests that a thicker shell results in a higher angle of deflection per volume added to a chamber.
From all of these results, we can conclude that the most effective tail, when optimizing only for angle of deflection per volume added, is a tail with a thick shell and thick ribs.
Deflation
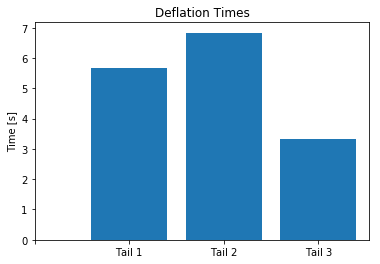
In Figure 10, we can see a comparison of how fast each tail deflates. When we compare Tail 1 and Tail 2, we can see that Tail 1 deflates faster than Tail 2. The difference between the two tails is that Tail 1 has 4 mm thick ribs while Tail 2 has 2 mm thick ribs. This suggests that thicker ribs result in a faster deflation time.
When we compare Tail 3 with Tail 1 and Tail 2, we see that Tail 3 has the fastest deflation time. When we compare Tail 3 and Tail 2, the difference between the two tails is that Tail 3 has a 3 mm shell whereas Tail 2 has a 2 mm shell. This suggests that a thicker shell results in a much faster deflation time. When we compare Tail 3 to Tail 1, we find that Tail 3 deflates faster with its thicker shell, despite that Tail 3’s ribs are thinner than Tail 1’s.
Overall, these results suggest that thicker ribs combined with a thicker shell would create the fastest deflation time from the soft tail.